Exploring the Fruit Market
By: Zavion Green
With fruit prices on the rise, consumers are faced with the challenge of selecting the best value for their money. This dataset compares various fruits by their respective price units and cup-equivalent prices, providing a clearer picture of cost efficiency. Additionally, the data highlights which fruits are classified as superfruits, offering insight into both affordability and nutritional benefits. By analyzing these factors, consumers can make more informed purchasing decisions based on both price and health value.
| Fruit | Form | Retail Price | Retail Price Unit | Cup Equivalent Price | Superfruit? |
|---|---|---|---|---|---|
| Apples | Fresh | 1.8541 | per pound | 0.4996 | No |
| Apples | Canned in Juice | 1.1705 | per pound | 0.6323 | No |
| Apples | Juice to Drink | 0.8699 | per pint | 0.4349 | No |
| Apples | Juice Frozen | 0.6086 | per pint | 0.3043 | No |
| Apricots | Fresh | 3.6162 | per pound | 1.4145 | No |
| Apricots | Canned in Juice | 1.8645 | per pound | 1.0071 | No |
| Apricots | Canned in Water or Syrup | 2.2362 | per pound | 1.5169 | No |
| Apricots | Dried | 7.6611 | per pound | 1.0978 | No |
| Bananas | Fresh | 0.5971 | per pound | 0.3085 | No |
| Berries, mixed | Frozen | 4.2673 | per pound | 1.4112 | Yes |
| Blackberries | Fresh | 6.7483 | per pound | 2.2471 | Yes |
| Blackberries | Frozen | 4.8277 | per pound | 1.5965 | Yes |
| Blueberries | Fresh | 4.1575 | per pound | 1.399 | Yes |
| Blueberries | Frozen | 3.821 | per pound | 1.2636 | Yes |
| Cantaloupe | Fresh | 0.7523 | per pound | 0.5528 | No |
| Cherries | Fresh | 4.6632 | per pound | 1.7321 | No |
| Cherries | Canned in Water or Syrup | 5.2418 | per pound | 3.5558 | No |
| Clementines | Fresh | 1.5811 | per pound | 0.9507 | No |
| Cranberries | Dried | 5.0828 | per pound | 0.626 | Yes |
| Dates | Dried | 5.7499 | per pound | 0.9507 | No |
| Figs | Dried | 7.3233 | per pound | 1.2613 | No |
| Fruit cocktail | Canned in Juice | 2.394 | per pound | 1.2931 | No |
| Fruit cocktail | Canned in Water or Syrup | 2.0996 | per pound | 1.4242 | No |
| Grapefruit | Fresh | 1.4444 | per pound | 1.3647 | No |
| Grapefruit | Juice to Drink | 1.1935 | per pint | 0.5968 | No |
| Grapes | Fresh | 2.0363 | per pound | 0.7014 | No |
| Grapes | Dried | 3.9936 | per pound | 0.6603 | No |
| Grapes | Juice to Drink | 1.0509 | per pint | 0.5255 | No |
| Grapes | Juice Frozen | 0.7524 | per pint | 0.3762 | No |
| Honeydew | Fresh | 1.1589 | per pound | 0.9442 | No |
| Kiwi | Fresh | 2.6064 | per pound | 1.3231 | Yes |
| Mangoes | Fresh | 1.4698 | per pound | 0.7531 | Yes |
| Mangoes | Dried | 10.3035 | per pound | 1.2906 | Yes |
| Nectarines | Fresh | 2.3721 | per pound | 0.8333 | No |
| Oranges | Fresh | 1.4624 | per pound | 0.8771 | No |
| Oranges | Juice to Drink | 1.0572 | per pint | 0.5286 | No |
| Oranges | Juice Frozen | 0.7338 | per pint | 0.3669 | No |
| Papaya | Fresh | 1.3375 | per pound | 0.6658 | Yes |
| Papaya | Dried | 7.4854 | per pound | 1.1552 | Yes |
| Peaches | Fresh | 2.1785 | per pound | 0.7755 | No |
| Peaches | Canned in Juice | 2.2503 | per pound | 1.2155 | No |
| Peaches | Canned in Water or Syrup | 2.0102 | per pound | 1.3636 | No |
| Peaches | Frozen | 3.6058 | per pound | 1.1924 | No |
| Pears | Fresh | 1.8472 | per pound | 0.7466 | No |
| Pears | Canned in Juice | 2.14 | per pound | 1.1559 | No |
| Pears | Canned in Water or Syrup | 2.092 | per pound | 1.4191 | No |
| Pineapple | Fresh | 0.617 | per pound | 0.4401 | No |
| Pineapple | Canned in Juice | 1.6509 | per pound | 0.8917 | No |
| Pineapple | Canned in Water or Syrup | 1.7771 | per pound | 1.2055 | No |
| Pineapple | Dried | 7.0133 | per pound | 1.0823 | No |
| Pineapple | Juice to Drink | 1.2243 | per pint | 0.6122 | No |
| Pineapple | Juice Frozen | 0.7256 | per pint | 0.3628 | No |
| Plum | Fresh | 2.5259 | per pound | 0.9775 | No |
| Plum | Dried | 6.3293 | per pound | 1.1861 | No |
| Plum | Juice to Drink | 1.6988 | per pint | 0.8494 | No |
| Pomegranate | Fresh | 2.4672 | per pound | 1.5055 | Yes |
| Pomegranate | Juice to Drink | 3.2788 | per pint | 1.6394 | Yes |
| Raspberries | Fresh | 7.7338 | per pound | 2.5753 | Yes |
| Raspberries | Frozen | 6.159 | per pound | 2.0368 | Yes |
| Strawberries | Fresh | 2.9682 | per pound | 1.0094 | Yes |
| Strawberries | Frozen | 3.3421 | per pound | 1.1052 | Yes |
| Watermelon | Fresh | 0.382 | per pound | 0.2429 | No |
AVERAGE of Cup Equivalent Price vs. Fruit
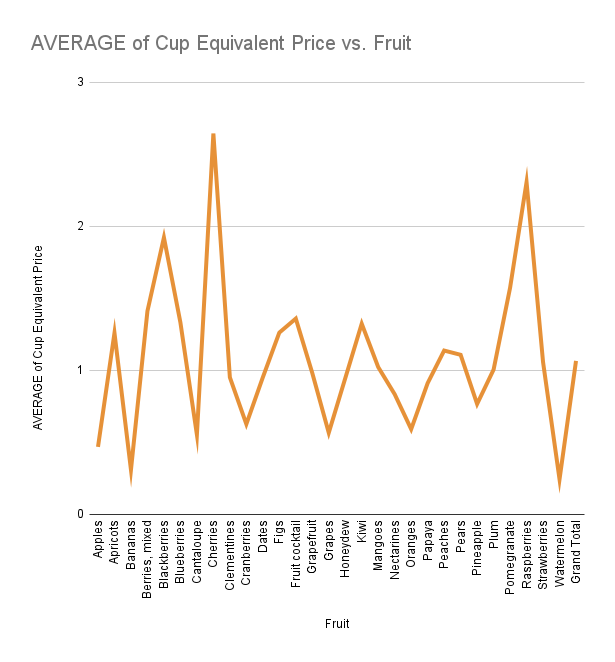 This chart presents the average cup-equivalent price for each fruit, allowing consumers to determine which options provide the most volume for their dollar. For example, while bananas and cantaloupes have similar retail prices, bananas offer a lower cost per cup equivalent, making them the more budget-friendly choice in terms of portion size. This comparison is particularly useful for individuals who prioritize both cost efficiency and quantity when purchasing fruit.
This chart presents the average cup-equivalent price for each fruit, allowing consumers to determine which options provide the most volume for their dollar. For example, while bananas and cantaloupes have similar retail prices, bananas offer a lower cost per cup equivalent, making them the more budget-friendly choice in terms of portion size. This comparison is particularly useful for individuals who prioritize both cost efficiency and quantity when purchasing fruit.
AVERAGE of Retail Price vs. Fruit
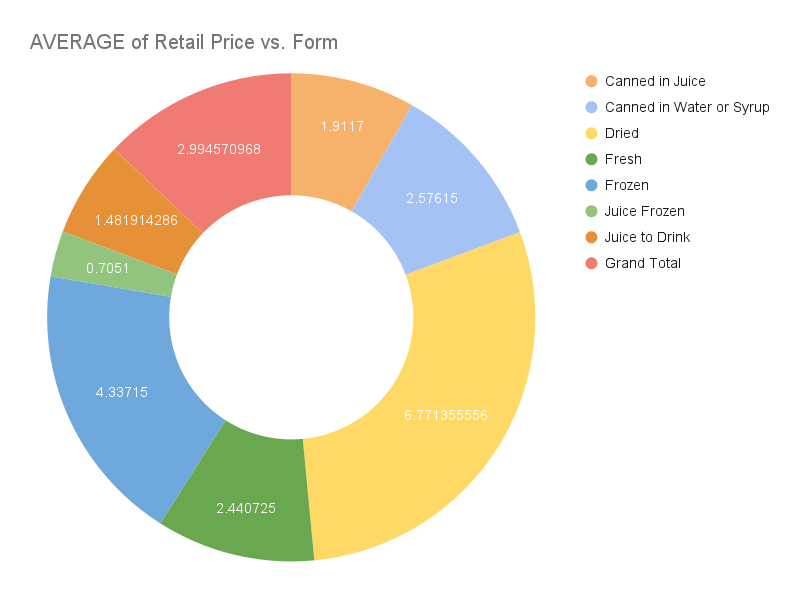 This chart visualizes the average retail price of each fruit, helping consumers identify which fruits are generally more affordable than others. For instance, this data reveals that apples tend to be cheaper than oranges on average. Understanding these price differences enables consumers to make cost-conscious decisions, especially when budgeting for fresh produce.
This chart visualizes the average retail price of each fruit, helping consumers identify which fruits are generally more affordable than others. For instance, this data reveals that apples tend to be cheaper than oranges on average. Understanding these price differences enables consumers to make cost-conscious decisions, especially when budgeting for fresh produce.
AVERAGE of Retail Price vs. Form
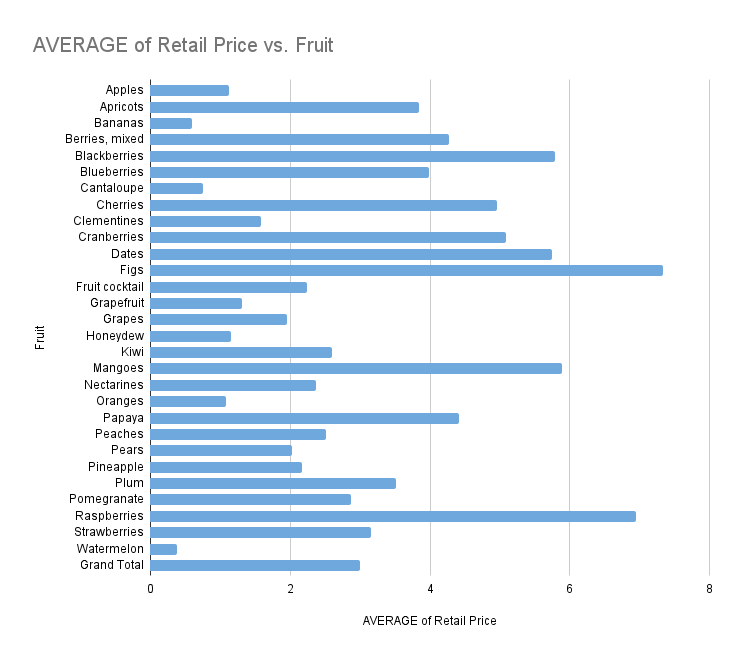 This chart compares the average retail prices of fruits in different forms, such as fresh, frozen, and processed. This comparison helps consumers determine which fruit forms are more economical. For example, the data suggests that purchasing apple juice is typically more affordable than buying fresh apples. Such insights can be valuable for shoppers looking to balance convenience, price, and dietary preferences.
This chart compares the average retail prices of fruits in different forms, such as fresh, frozen, and processed. This comparison helps consumers determine which fruit forms are more economical. For example, the data suggests that purchasing apple juice is typically more affordable than buying fresh apples. Such insights can be valuable for shoppers looking to balance convenience, price, and dietary preferences.